

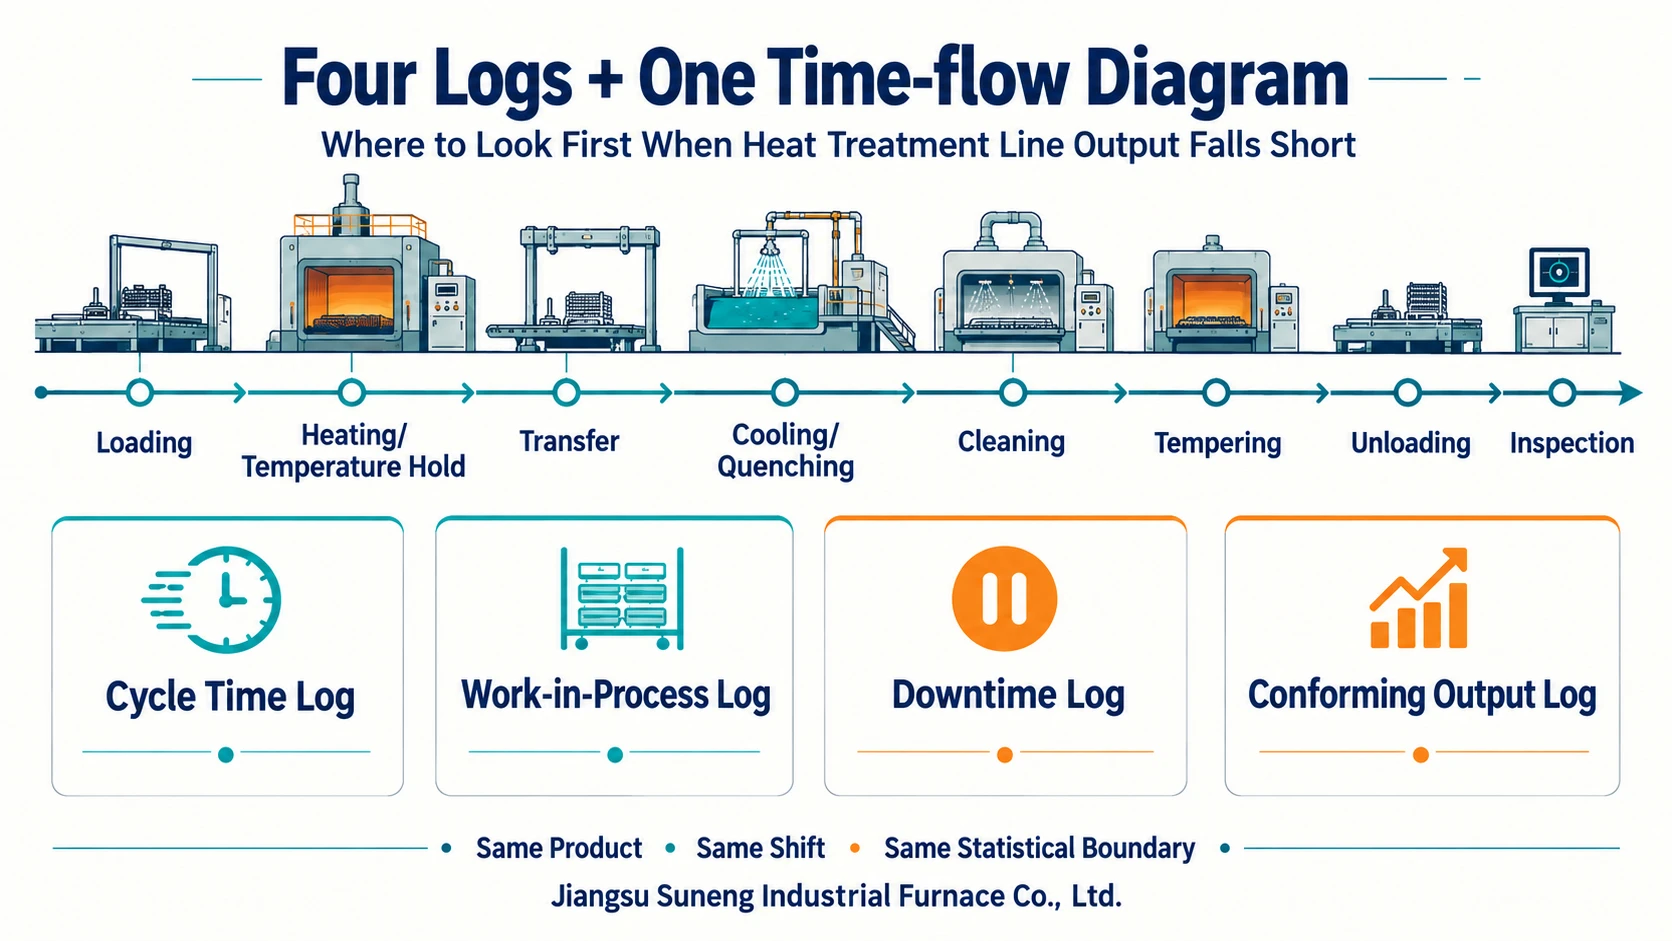
Do not begin by increasing main-furnace speed or focusing on one machine. Suneng recommends a complete-line time-flow diagram and four logs: cycle times, work in progress, downtime and conforming output. Use the same product, shift and measurement boundary to locate losses in heating, transfer, cooling, washing, tempering, handling or quality/rework.
Suneng continuous-line documents distinguish speeds, residence requirements and exception records for different process sections. If the main furnace shows normal speed but line output is low, compare empty loading positions, downstream waits and stoppage causes on one timeline, then distinguish pieces passing through from acceptable finished output. Locate the actual losses before changing scheduling, interfaces or equipment; increasing speed is not a universal remedy.
The illustration groups flow and the four logs; bottlenecks can move along the line.
Why increasing furnace speed can reduce stability
Actual line capacity follows its most constrained operation, which can change with product, process, changeover and equipment condition. Faster furnace passage may only create downstream waiting. If speed shortens required residence, an output problem can become a quality problem.
Archived Suneng continuous-line proposals tie capacity to workpiece shape/size, individual weight, spreading, material and process. Sections have distinct speed/residence requirements; controls separately record speed, output, operations, alarms and faults, with sequential interlocks maintaining relationships. Nameplate speed alone is therefore insufficient for diagnosis.
Define what “capacity” means
The concern may be parts per hour, batches per shift, conforming output, delayed delivery or a brief instantaneous shortfall. Agree five boundaries: product/mix, measurement start/end, period, planned shifts and conformity basis. Input, main-furnace exit, line exit and final-inspection counts are not interchangeable.
One diagram: actual product time through the line
This is a time-flow diagram, not a floor plan. At each actual station, record arrival, start, finish, waiting and departure. Put stops, storage, rework and manual handling on the same timeline.
Include actual loading, heating/holding, transfer, cooling/quenching, washing, tempering, discharge and inspection as applicable; show parallel machines and buffers with splits/merges. Do not invent absent operations. Display both equipment operating time and product waiting time to expose asynchronous handovers, release waits, material changes and recovery losses.
Log 1: cycle times
For timing records, state the measured object and start/end events. Record a part or batch’s start-to-finish processing duration separately from the interval between successive completed parts or batches. Parallel stations, batch processing and buffers mean these quantities may differ. Also separate set speed, theoretical time and actual records. Relate continuous heating length to residence time, and record normal, changeover and recovery states; the fastest empty run cannot replace loaded timing.
If the same product varies strongly between shifts, investigate loading, operation, supply, medium and equipment condition rather than averaging away the variation.
Log 2: work in progress
Record quantities and waits in buffers, baskets, conveyor sections and around stations. Persistent accumulation suggests downstream capacity, release or transfer constraints. Repeated starvation may indicate supply, loading, changeover or upstream instability. Counts alone need waiting reasons.
Short buffers can absorb variation, but repeated full/empty states may conceal an unstable relationship between stages.
Log 3: downtime
Go beyond “fault” and “waiting for material”. Separate planned changes/maintenance, upstream starvation, downstream blockage, utilities/media, alarms, quality holds, manual actions and other causes. Record start/end, responsibility, action and restart conditions.
Frequent short stops can exceed one conspicuous long stop. Resetting without closing the cause lets losses recur. Suneng aligns downtime with the flow diagram, fault point, interlock and product to distinguish equipment, interface, process and quality triggers.
Log 4: conforming output
Equipment-exit quantity is not stable conforming output. Separate input, normal output, awaiting inspection, rework, scrap and final release; link product, recipe version, shift and exceptions.
More throughput may not improve delivery if retesting/rework/scrap rise. Quality losses concentrated after a product change or recovery can help locate the problem. Customer process/inspection documents determine conformity; equipment data supports analysis but does not replace material, sampling or test rules.
Read the four logs together
| Observed condition | Check first | Possible direction to investigate |
|---|---|---|
| Main furnace frequently starved | Work in progress and upstream cycles | Supply, loading, changes or upstream faults |
| Persistent accumulation after furnace | Downstream cycles and work in progress | Cooling, washing, tempering, discharge or release |
| Large shift-to-shift variation | Downtime and cycles | Short stops, operation, utilities/media or product changes |
| Normal displayed speed but low output | Measurement boundary and work in progress | Empty positions, spreading, waiting, recirculation or count location |
| Higher throughput without more conforming output | Conforming output and process records | Residence, medium, recovery or inspection basis |
| Bottleneck moves after a change | Diagram and all four logs | New limiting operation or interface |
The table sets investigation order, not a retrofit conclusion. Establish reliable data before changing scheduling, operation, controls, buffers, equipment or process.
Four common misjudgements
- Using nameplate/proposal theoretical capacity as proven stable site output without product, process, shift and stop checks.
- Looking only for the slowest-rated machine when quality holds, interfaces or changes may limit the line.
- Using average cycle time to hide short stops and local accumulation.
- Changing equipment before collecting a comparable baseline, leaving improvement attribution uncertain.
Scope and first diagnosis
Use the method for multi-stage continuous lines with buffers or integrated adjacent equipment, new-line ramp-up and operating-line diagnosis. A batch furnace can simplify to batches, waiting, downtime and conforming output. ISO 20431:2023 provides public quality-audit/facility/specification context. Capacity changes must respect process/quality requirements and applicable safety, product and acceptance documents.
Start with a representative recent product/mix, flow diagram, one shift's input/conforming output and corresponding downtime. State counting positions and times even if other data are incomplete. Suneng can identify cycle, waiting, downtime or quality losses and missing measurements. Control, tooling, buffer, equipment or process changes require confirmed site conditions and responsibilities.
Information basis
- Archived Suneng continuous-line proposals covering capacity boundaries, section speeds/residence, sequential interlocks, output, alarms and faults; only anonymised diagnostic methods are presented.
- ISO 20431:2023, Heat treatment — Control of quality.
Related Pages and Sources
- ISO Standard Information
- Suneng Industrial Furnace
- Continuous Heat Treatment Line Planning
- Contact the Suneng Engineering Team